In this tutorial, you will learn how to use the Visual Studio Code debugger for Python. Knowing how to use a debugger is a valuable skill for when programming. But a debugger is also very useful when you’re learning how to program.
We will learn the basics of using a debugger and see examples of how it can help you learn programming.
I have another useful beginner tutorial for Python about virtual environments: Python Virtual Environment (venv): easy guide for beginners.
Contents
- 1 What is a debugger?
- 2 How to use the Visual Studio Code debugger for Python
- 3 Changing code while the program is paused
- 4 Conclusion
What is a debugger?
A debugger is a tool that lets you pause running code and step through the execution of code you have written line by line. Also, the debugger lets you inspect the values of variables that have been set. That way you will instantly see what is going on in your code. You can see changes in real-time. Sometimes it can be difficult to reason in our minds how certain code will behave, a debugger helps us understand the programs in situations like that.
A debugger has useful features and we will look at practical examples of some of them using Visual Studio Code and a Python debugger in a later section of this article. First, here are descriptions of these features:
Breakpoints
When you use a debugger, like the Visual Studio Code debugger for Python, you usually set what are called “breakpoints” on lines of code you want to inspect. Breakpoints are markers that you can set to pause the execution of your program on a specific line of code. The code will run up to the line with the breakpoint and then pause. Then you can see all the variable values of the surrounding code. From that point, you can step through the code line by line to see the behavior of the code.
Conditional Breakpoints
You might not want to stop on a line of code every time. That’s where conditional breakpoints come in. Let’s say you have a loop that goes through values in a large array, and you only want to see what happens if a specific value in the array is processed. Normally the code would pause at your breakpoint for each value that is processed. However, you can set a condition on the breakpoint so that it only triggers a pause when that condition is met. For example, when the index or assigned variable from the loop is the specific value you care about.
Step over/into/out
As mentioned a debugger lets you step through code line by line. A common mode of stepping is “step into”. This means that the debugger will step into any lines such as functions and jump to the code of that function. This is useful when you want to follow the entire flow of the code.
However, it is also often the case that you don’t really need to see the code inside of a certain function because you already know what it does. In that case, you can use “step over” to execute all the code in the function without stepping through each line. Then the debugger will pause again when the function has finished executing.
Finally, there is “step out”. This is used to step out of a function to the code that called it. Let’s say you have stepped into a function to check the behavior of some lines of code in there but you don’t want to go through the entire function line by line. If you do a “step out” the debugger will execute the remaining code of the function normally (unless there are other break points) and then pause code execution again on the line that called the function after it has completed.
Viewing the call stack
With a debugger, you can even see all the functions that were called before the code at the breakpoint. This is called the “call stack”. The call stack is a data structure that stores information about the active subroutines (or functions) of a computer program. It’s essentially a stack, operating on the Last In, First Out (LIFO) principle. Here is a link to a wiki page on the call stack.
When a function is called in a program, an entry (often called a “frame”) is pushed onto the call stack. As functions call other functions, more frames are pushed onto the stack. When a function completes, its frame is popped off the stack. Then control is returned to the function at the next frame down in the stack.
Being able to look at the call stack is useful. Because often the functions you write will be called from different parts of the program. If you want to know the flow of how a particular function was called, look at the call stack. Then with the debugger and setting a breakpoint on the appropriate line of code you will be able to figure out what code preceded the breakpoint. Also why the values of variables are what they are.
Watch expressions
Watch expressions allow you to track the changing values of variables in real-time as the code is executing. When you add a variable or an expression to the Watch list in your debugger, its current value is displayed. Then this value is dynamically updated as you step through your code. You can watch simple variables, complex objects, or even specific expressions involving these variables. For example, you can create a watch expression as the result of a calculation of multiple variables.
How to use the Visual Studio Code debugger for Python
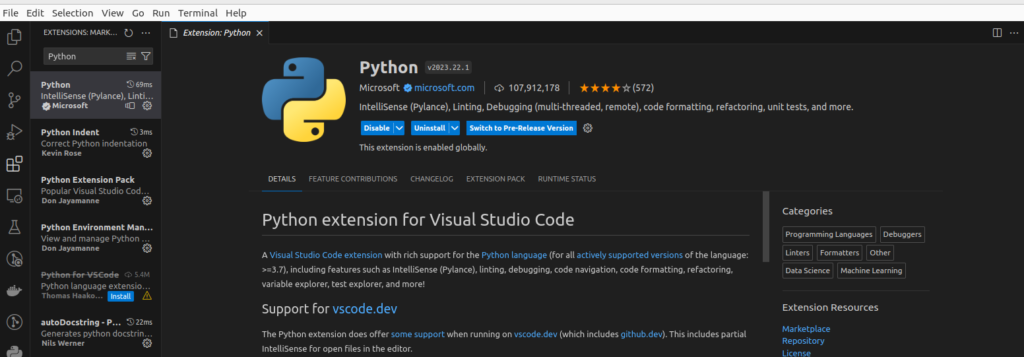
First, we need to have the Python extension for Visual Studio Code installed. This extension can be installed directly in Visual Studio Code as well. Just look for “Python”:
This Visual Studio Code extension comes with a debugger for Python as well as other features.
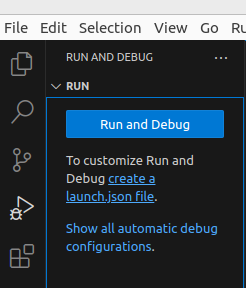
Then you should create a launch.json file using the “run and debug” menu with the button in the left vertical menu:
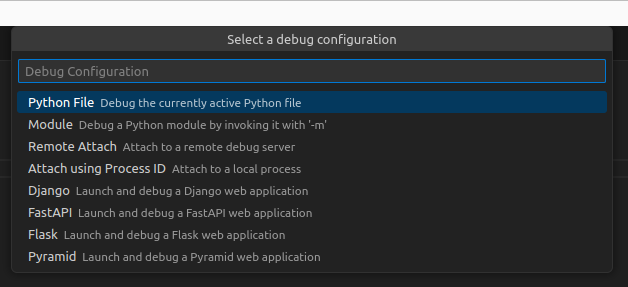
Then a menu should open with “Select a debug configuration”. Select “Python File Debug the currently active Python file”:
A file called launch.json is created with the following contents:
{
    // Use IntelliSense to learn about possible attributes.
    // Hover to view descriptions of existing attributes.
    // For more information, visit: https://go.microsoft.com/fwlink/?linkid=830387
    "version": "0.2.0",
    "configurations": [
        {
            "name": "Python: Current File",
            "type": "python",
            "request": "launch",
            "program": "${file}",
            "console": "integratedTerminal",
            "justMyCode": true
        }
    ]
}
Now let’s see how to use the debugger.
Setting a breakpoint
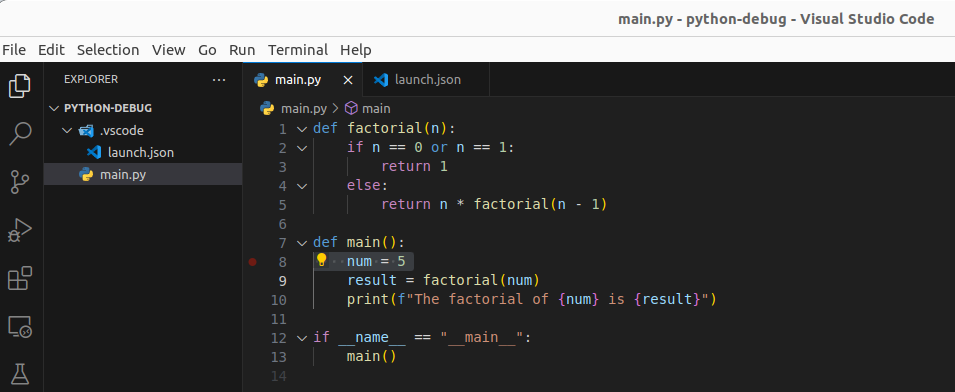
Before we start the debugger we need some code to debug. We will create a file called main.py and copy the following code into it. It is code to calculate a factorial:
def factorial(n):
    if n == 0 or n == 1:
        return 1
    else:
        return n * factorial(n - 1)

def main():
    num = 5
    result = factorial(num)
    print(f"The factorial of {num} is {result}")

if __name__ == "__main__":
    main()
When we run the program with python main.py we get this result in the console: The factorial of 5 is 120.
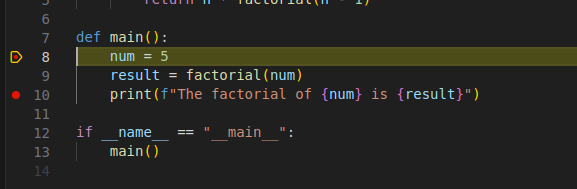
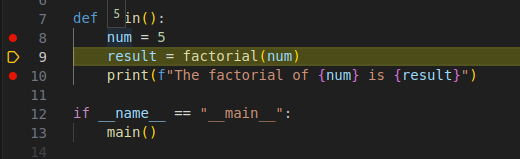
To see how breakpoints work click on the left side of the vertical number line and click next to line number 8. When you hover over with your mouse you should see a dark red dot appear. After you click the red dot should become a brighter red color.
When hovering:
Then setting the breakpoint:
Now when we run the program with the debugger the program will pause on line 8.
Run the Visual Studio Code Python debugger
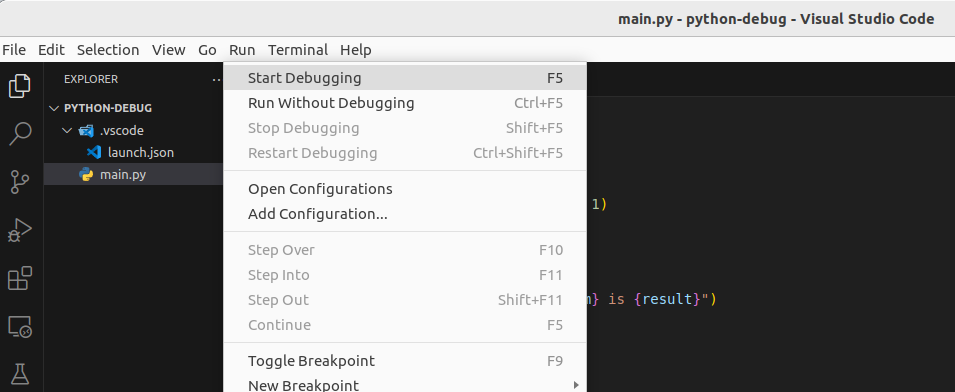
Press the F5 key or start debugging from the Run menu:
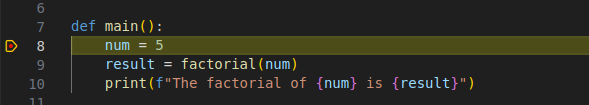
Then a new mark appears next to line 8 and the line is highlighted as well.
There is also a new control in the top center of the window with several buttons for “continue”, “step over”, “step into”, “step out”, “restart” and “stop”:
The functions for these are:
- continue: continue running the program until the next breakpoint.
- step over: step over the line of code without going into it (if it is a function). The code will still be executed.
- step into: jump to the code where the function is defined and continue pausing from there.
- step out: step out of the current function, execute all the remaining code (or pause at the next break point in the function), and then pause after the function has completed.
- restart: restart the entire program and run until the first breakpoint.
- stop: stop the program and stop debugging.
Click the “continue” button and see what happens: the program completes and shows the same output as before.
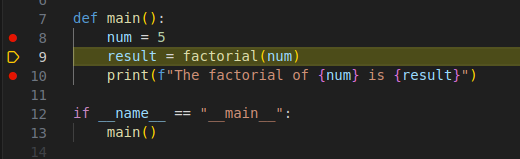
Next, let’s run in debug mode again by pressing F5, and then when the program has paused, put a breakpoint on line 10:
Click the “continue” button and the debugger will pause the program on line 10:
This demonstrates that we can set breakpoints at any time, even when the program is already running. Finally, clicking “continue” again will now run the program until it is completed.
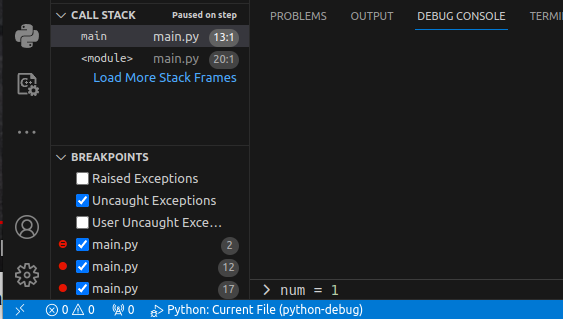
Breakpoint list
On the bottom left of the screen we can see a list of breakpoints and other things:
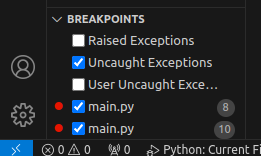
Here we can see all the breakpoints that are active and what files they are located in. In this case, we see our breakpoints in the main.py file on lines 8 and 10.
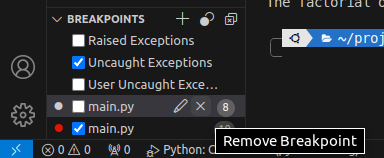
We can disable a breakpoint, so the program is no longer paused there, by unchecking the checkbox, or even remove it:
We can also edit the break point to add a condition so it doesn’t break by default, but only when a condition is met.
There are also other checkboxes with text in this section of the debugger UI:
- Raised Exceptions: when enabled, tells the debugger to pause execution whenever an exception is thrown or raised in the program, regardless of whether it is later caught by a try-except block. This is useful for detecting and investigating exceptions as soon as they occur, which can be especially helpful in identifying the root cause of an error.
- Uncaught Exceptions: the debugger will pause the program only when an exception is thrown and not subsequently caught by any try-except block. This is useful for debugging exceptions that are causing your program to crash or exit unexpectedly. As it ignores exceptions that are caught by your code.
- User Uncaught Exceptions: This setting is somewhat similar to uncaught exceptions but is more specific. In some environments, it refers to exceptions that occur in user-written code but are not caught within that same scope of user code. This is useful when your code interacts with external libraries. The debugger will ignore exceptions that are raised and caught within these external components, only pausing on exceptions that your own code didn’t handle.
Debugger controls: step over, step into, step out
In this section, we will get familiar with the “step over”, “step into”, and “step out” functionality of the debugger controls. These functions help us examine the flow of the code. By stepping through the code line by line and going in and out of functions.
Step over example
Step over is useful if you don’t want to go through every line of a function that is being called. In this example, we will skip over the function factorial on line 9. The function will execute but the debugger won’t pause on any of its lines.
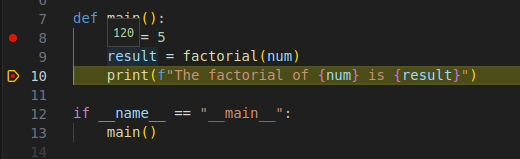
So, let’s run the programming with the debugger again and try clicking step over after the program has paused on line 8. Make sure you have not disabled the breakpoint on line 8. After clicking on step over the debugger will move to the next line:
What is the result of this? Well, line 8 has been executed by Python now and the value 5 has been assigned to num. If we hover over the num variable its value will be displayed in a pop-up:
We will get into inspecting variables and their values a bit more in a later section.
The debugger is now paused at line 9 where the factorial function is called. If we click “step over” again it will go onto the next line 10 and result will have been assigned a value of 120:
Since line 10 is the last line of the program, clicking “step over” again will complete the run of the program.
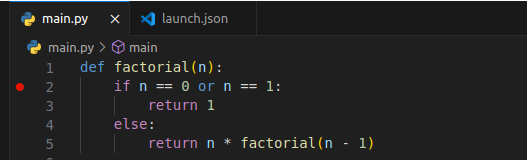
Note that “step over” will still stop at any breakpoints that are on lines of code for the function. For example, let’s place a breakpoint on line 2 of the code:
Now when we run the program with the debugger and try to step over line 9 where factorial is called, the program will pause on line 2 instead of moving on to line 10:
Remove the breakpoint on line 2 and click continue so the debugger pauses on line 10 again. Then hit stop or continue to stop executing the program.
Step into
Step into is a way to go into functions to continue examining the code there. Similar to what happened when we set a breakpoint on line 2. However, in this case, there won’t be a breakpoint set. We just continue stepping through the code of the function instead of stepping over it:
Since this factorial function is a recursive function we keep stepping into new calls of the factorial function when we click “step into”. As you can see with the debugger jumping to line 2 of the code after “step into” is clicked when line 5 is highlighted.
Step out
Finally, let’s use “step out” to get out of the function again. This feature, “step out”, will run all of the code in the current function and pause at the point where the function was called when the debugger stepped into it. Unless there are breakpoints along the way.
Depending on how many times you stepped into the recursive calls of the factorial function it might take a few clicks to get completely out of it onto line 9 again:
Inspecting variables
To understand what the code is doing, besides going through the flow of the code, we should also look at what values our variables and objects have.
There are several methods for inspecting the values of variables:
- Hover over the variable
- Variables pane
- Watch pane
- Debug Console
We will look at all of these now.
Hover over variables to inspect
We have already seen how this works with integers earlier. We can also inspect more complex variable values, of course. For example, dictionaries with key/value pairs and arrays.
Update the program with the following code and save the main.py file:
def factorial(n):
    if n == 0 or n == 1:
        return 1
    else:
        return n * factorial(n - 1)

def main():
    factorial_runs = {
        "values": [5,6,3],
        "results": []
    }
    for num in factorial_runs["values"]:
        result = factorial(num)
        factorial_runs["results"].append(result)
        print(f"The factorial of {num} is {result}")

    print(f"all results: {factorial_runs}")

if __name__ == "__main__":
    main()
Then make sure to update the positions of the breakpoints as well. Clear all the current breakpoints by clicking on them or removing them in the “breakpoint” pane in the UI.
Then set breakpoints on lines 12 and 17:
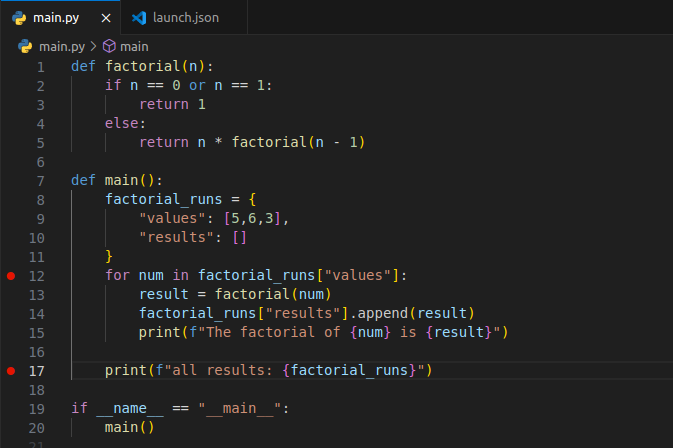
Our program now has a dictionary called factorial_runs with an array of values and an empty array for results. The code loops through the values in the array and calls the factorial function for each one and then appends the result to the array under the results key in the factorial_runs dictionary.
Run the program and hover over the factorial_runs variable:
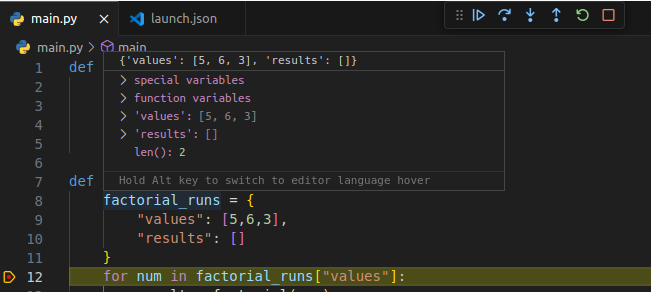
We can see its properties: 'values', 'results', and len(). In this case, len() is 2 because this dictionary has 2 keys. Of course, initially, the properties have the exact values that were assigned on lines 8-11.
What happens if we click “step over” until we hit line 15? Then the code appends a new result to the empty results array:
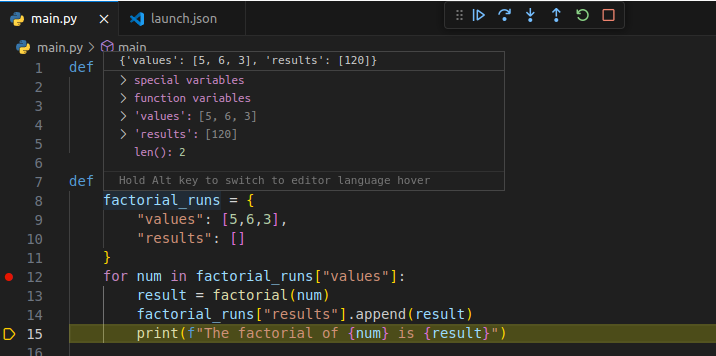
Now the array under the 'results' key in the dictionary has the value [120]. So we can see this dictionary updating as the program is running. This is very useful when you want to figure out what a program is doing!
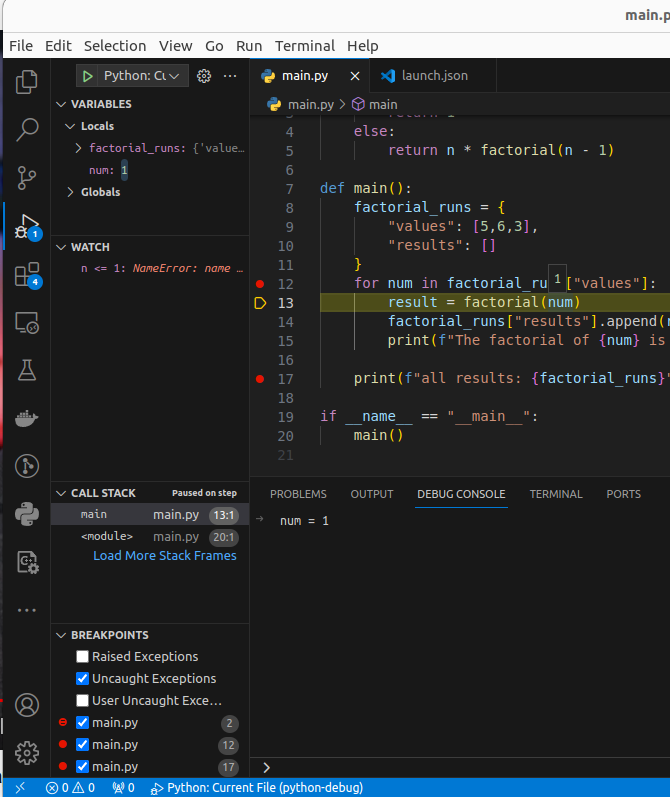
Variables pane
Next, let’s look at the debugger variables pane on the left side of the Visual Studio code UI where we can see our Python variables as well.
This is what we can see when we run the program with the debugger and step to line 15:
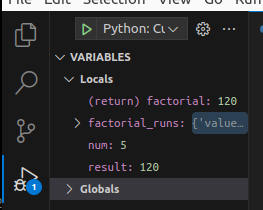
There are two sections under “VARIABLES”:
- Locals: These are the variables that exist in the current local scope.
- Globals: Here you see variables that are in the global scope.
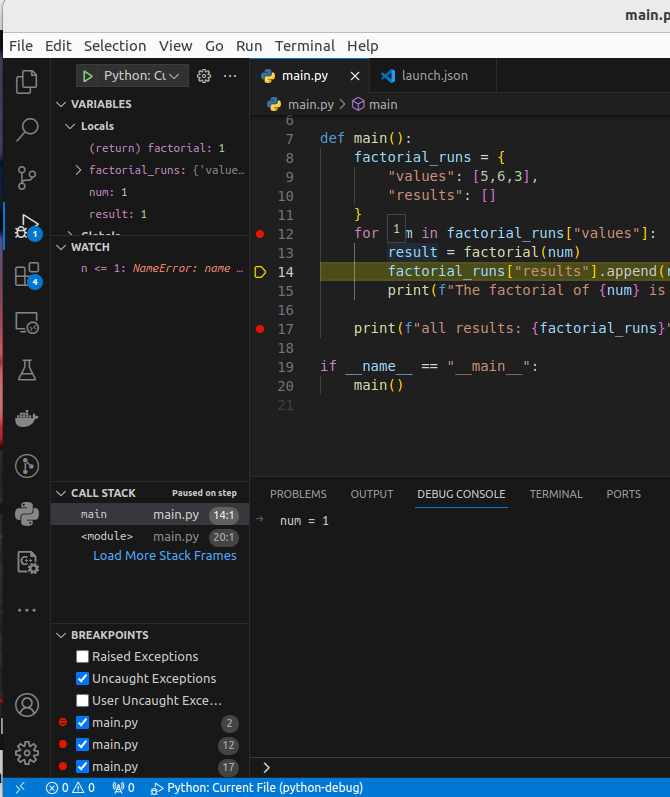
Under “Locals” we not only see the factorial_runs, but also num and result variables. These are the variables on line 12 (num) and line 13 (result) respectively.
All of these variables will change as we step through for loop iterations:
As you can see the “VARIABLES” pane is a good way to track values for multiple variables at the same time.
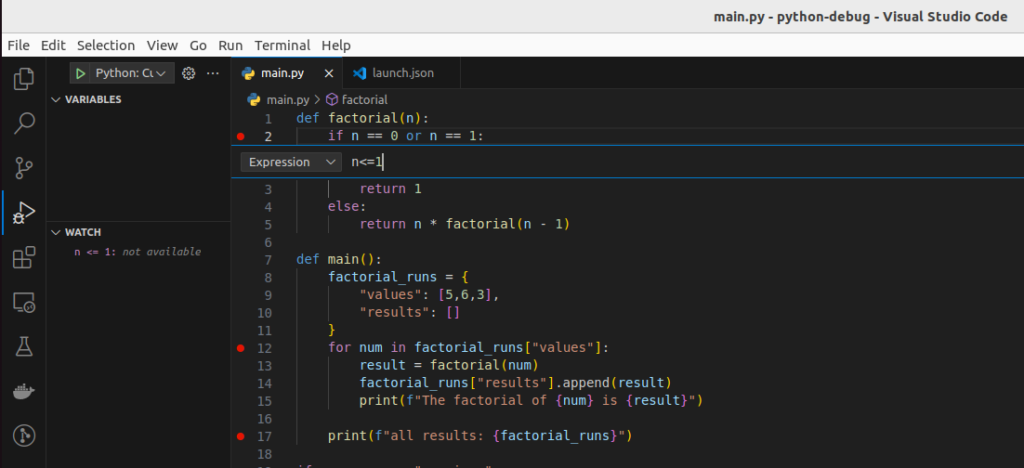
Watch pane
With the watch pane, we can track the result of expressions. For example, we could keep track of when we reach the lowest depth of the recursion. To do this we can add an expression n <= 1 which corresponds to the condition on line 2. If the expression is true it means we will have reached the lowest depth of the recursion. Since the factorial function will keep being called in the recursive function until the condition on line 2 is True.
So let’s add an expression to the watch pane, by clicking on the “plus” button:
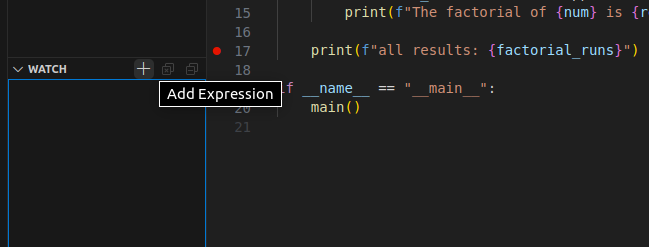
Then type in n <= 1:
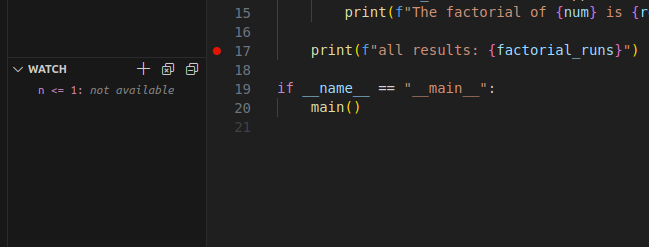
Currently, the result is not available because the program is not running and also because the variable n is not in scope.
So let’s set a breakpoint on line 2 and run the program until it reaches this breakpoint on line 2:
Now we can see that the expression n <= 1 in the “WATCH” pane evaluates to False. Because n has the value 5.
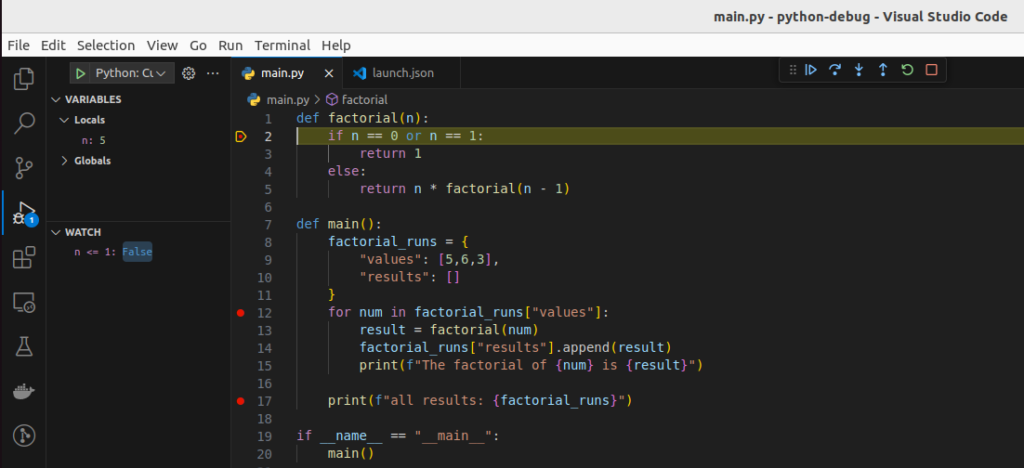
Then if we click “continue (F5)” a couple of times the “WATCH” expression should eventually evaluate to True:
This is a simple example, of course, however, you can see how being able to put any kind of expression here can be helpful.
Conditional breakpoints
Breakpoints can be conditional. You probably noticed that the breakpoint on line 2 pauses the program every time the code arrives at that line of code, as expected. There are situations where you will want to stop at a certain line only when certain conditions are true. In this case, for example, if n was an even higher number than 5 at the start, it would take a very long time to reach the n <= 1 condition.
If we right-click the breakpoint we get an option to “Edit breakpoint…”:
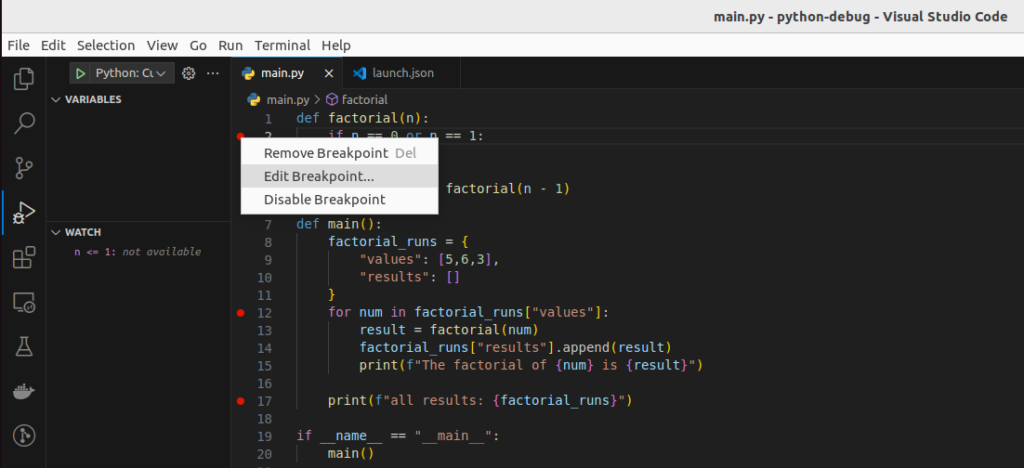
Enter the condition n<=1:
Then press enter to confirm the condition.
Now when we run the program in the debugger the program will only pause on line 2 if the condition n <= 1 is True.
Debug Console
In this section, we will look at the debug console. The debug console enables us to execute any code while the program is paused in the debugger. In other words, this is another way to inspect code, evaluate expressions, and view the values of variables. Another way to understand the flow of your programs.
On top of that, with this feature, we can also directly affect the program. For example, we can change the values of variables or call different functions to see what would happen in other scenarios. This is especially useful for identifying and fixing bugs or unexpected behavior in your code.
For example, if we run the program and step to line 13 we have access to the num variable. Make sure to click on the “DEBUG CONSOLE” tab and at the bottom there is a text prompt we can put text into:
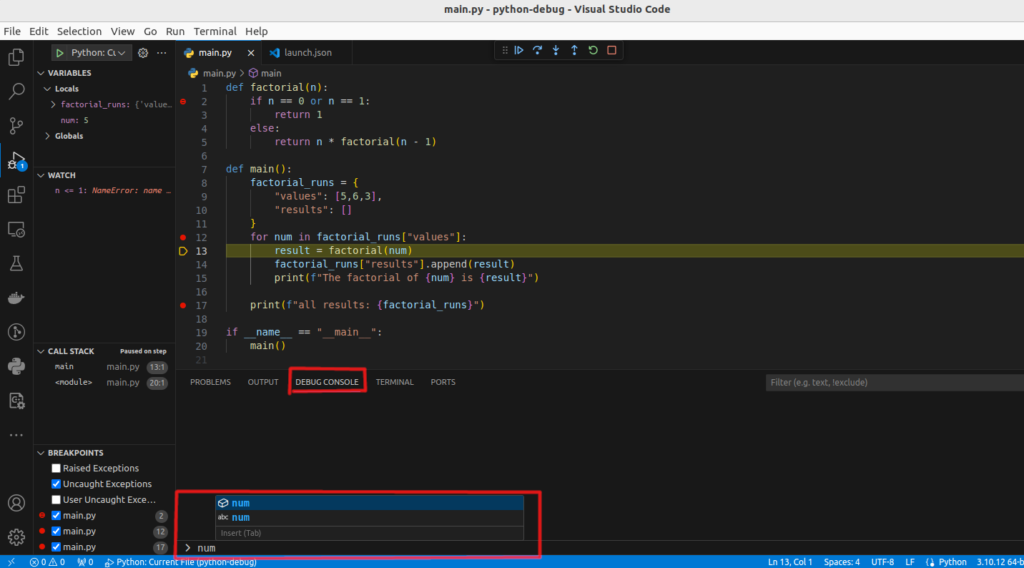
We get IntelliSense for auto-completion of what we type. VSCode recognizes that num is in scope as we type the letters. Pressing enter will give us the value of num.
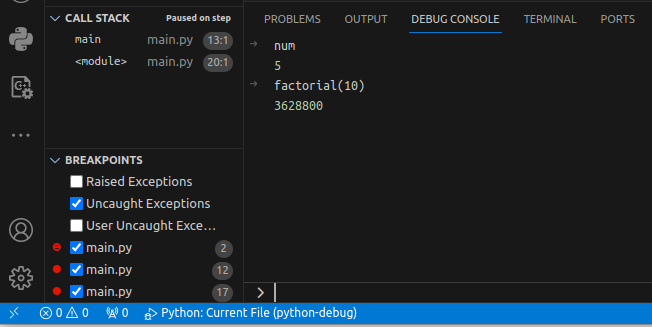
Next, let’s execute the factorial function in this debug console:
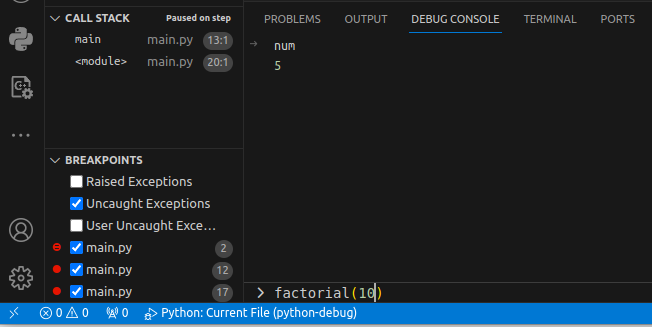
If we do this we can see results for other values that don’t exist yet in the program. For example, what would the result be after entering a value of 10?:
We can also change the value of a variable and let the program run:
We can see that the value has changed in the VARIABLES pane:
Of course, we will get the result value from the factorial function based on the input of 1 now:
The debug console is very useful for experimenting with different values when you’re working on some algorithm or when you’re trying to find the cause of some issue.
Changing code while the program is paused
One topic we have not covered yet is: “What happens if we change something in the code while the program is paused?”. The answer is: “nothing”. The changed lines will be “ignored” by the program. Because the original code for the program has been loaded into memory changing the program after it has been loaded doesn’t change the program that is in memory.
Let’s try it. Start or restart the debugger and while it is paused on line 12, add and extra line below line 13 and save the changes:
result = 5
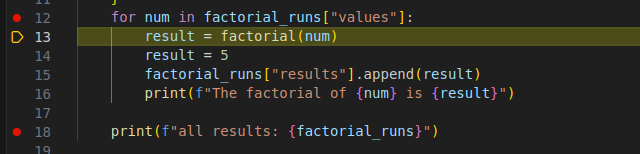
Now when we step through the program until we hit this line and then step further, something strange will happen:
It seems like the code executes the new line 14, however the value of result does not change. Furthermore, it looks like line 16 is skipped. Because the debugger suddenly jumps from line 15 to line 12. In reality, the old program is executing, before there was an extra line. In other words, the program executes line 15 as if it was on line 14 (where it was originally) and line 16 as if it was still on line 15.
This sounds confusing, but the main point here is that code changes while the program is paused will be ignored and the program will execute as it was before.
To execute the new code we have to restart the program. The easiest way to do this is by clicking the green arrow button on the debug controls. This will restart the debugger and reload the program into memory.
Conclusion
We have learned about the core functionality of the Visual Studio Code debugger for Python. Starting with an understanding of what a debugger is, we delved into its core components such as breakpoints, step controls, and viewing mechanisms like the call stack and watch expressions. These elements form the backbone of debugging, enabling developers to pause, inspect, and navigate through code to diagnose and fix issues.
We then transitioned to a practical guide on utilizing the Visual Studio Code debugger for Python, illustrating how to set breakpoints, run the debugger, and utilize its controls to step through code in various ways. The tutorial provided clear examples of stepping over, into, and out of functions, and demonstrated the importance of inspecting variables to understand the state of the program at any point in time. Through the hover feature, Variables pane, and Watch pane, we saw how to keep a close eye on the data flowing through our programs.
Furthermore, we discussed the utility of conditional breakpoints for more targeted debugging and how the Debug Console can be an invaluable tool for evaluating expressions and experimenting with values during the debugging session.
By now, you should have a solid foundation in debugging Python programs within Visual Studio Code. You should also realize that debugging is not only a tool for finding and fixing the cause of issues but also a tool for learning.
Follow me on X:
Follow @tmdev82