technical indicator
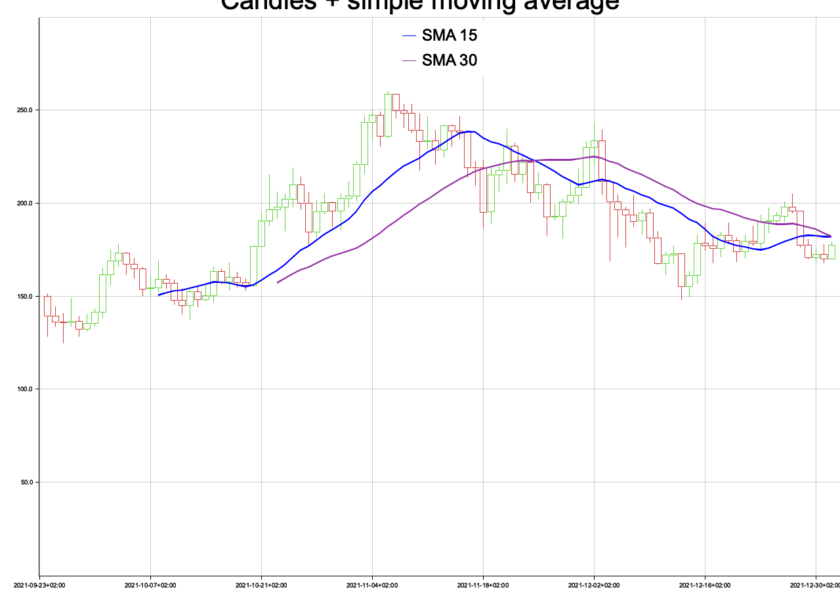
Plot Candles and SMA with Rust: learn how to
In this tutorial, we are going to learn how to plot Candles and the Simple Moving Average (SMA) technical indicator in Rust. We will use the plotters crate to make drawing a plot or chart easy. This will be a quick tutorial to learn the basics. For this simple tutorial, the data we will use is hard-coded data. In the next tutorial, we will download data from a real source and plot other technical indicators too. To calculate the Simple Moving Average we will use a function we wrote in an earlier tutorial: How to: technical indicators with Rust and…
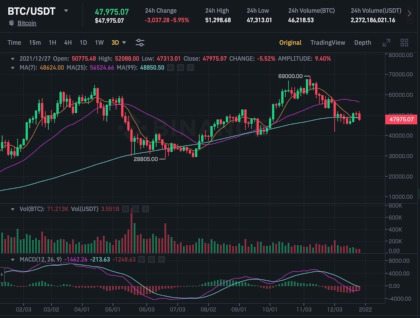
How to: technical indicators with Rust and Binance
In this tutorial, we will learn how to implement technical indicators with Rust using data from Binance. The aim of this tutorial is to be a fun exercise for people who are starting out with Rust and want to see a practical example of writing basic functions. First, we will implement algorithms for the following technical indicators: Simple Moving Average (SMA), Exponential Moving Average (EMA), Moving Average Convergence Divergence (MACD), Bollinger Bands (BOLL), and the Relative Strength Index (RSI). Then, we will download historical data from the Binance API and use that to apply our algorithms. We will also look…